April should be celebrated as Data Viz Month, the inauguration of a Data Viz Year that will highlight the inestimable importance of data visualization in our everyday lives. To kick this off are two momentous parallel events. The first is the introduction of the SVA MPS Data Visualization and Communications program, now accepting applications through April—the first such college degree opportunity in New York City, chaired by Jason Forrest. Second is the grand opening weekend from April 3–5 of the Data Vandals Newsstand, at the #6 / 51st Street subway station. Developed and designed by Forrest and artist Jen Ray, the exhibition space, explains Forrest, “will feature interactive displays as well as our first exhibition ‘NY by the numbers.’”
The Data Vandals are planning a schedule of events for the spring and summer. Ray will host DJs and a film screening: “It’ll be especially absurd because our inside space capacity is 12 people,” says Forrest, whose mission is to make data accessible to all.
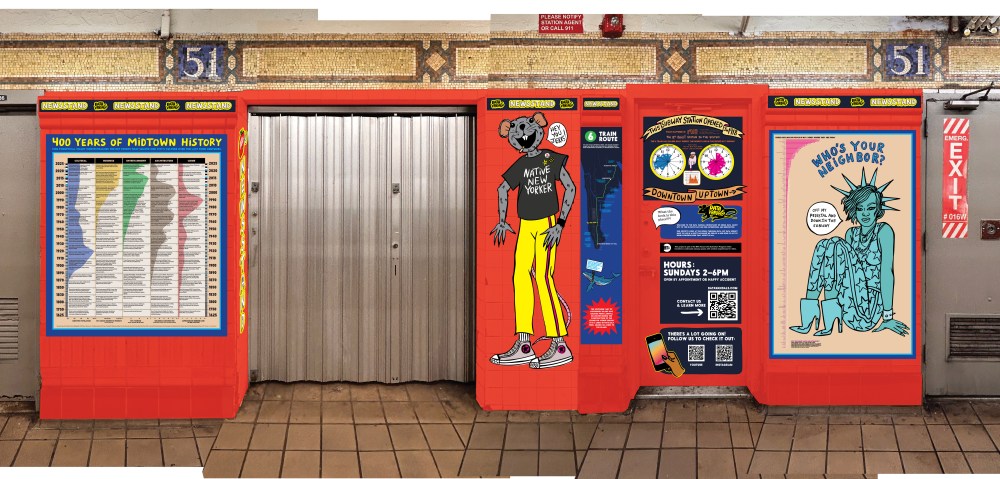
The outside of the newsstand will be wrapped in vinyl and has four sections:
1. A synoptical chart showing 400 years of midtown history. It’s organized by theme: culture, business, entertainment, architecture, and crime.
2. Our 6-foot-tall rat mascot, Ratsy, for selfies and interesting facts about the 6-train stops.
3. The door features facts and history about the 51st Street station, busiest times of day, some info about our hours.
4. Data showing the country of origin for all 8.8 million New Yorkers, with a big updated Statue of Liberty.
The post The Daily Heller: Data Vandals Underground appeared first on PRINT Magazine.